Graph Check List

A very practical checklist for your everyday graphs.
A very practical checklist for your everyday graphs.
Choosing the right graph type is the most important choice you'll make.
Choosing how to display your data can emphasize different aspects.
A paper about a new rat model stain with many graphs with matching formatting.
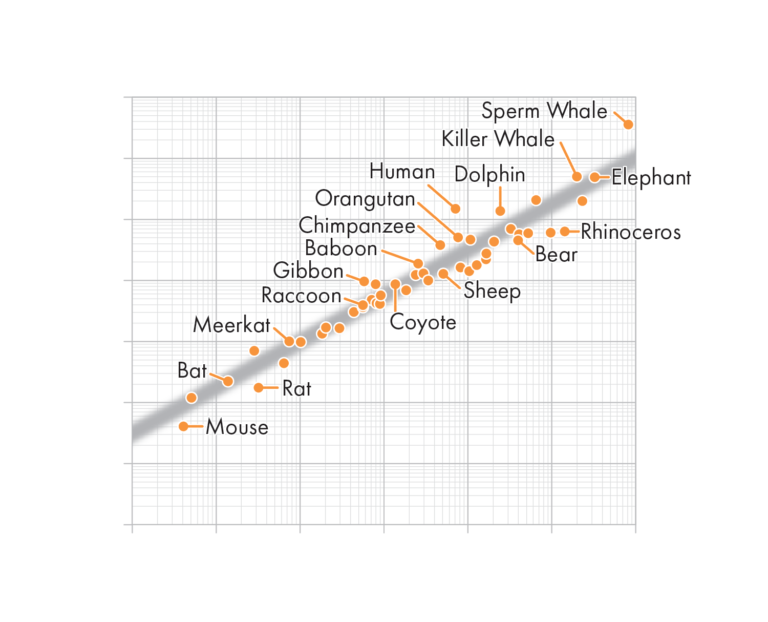
Graphs from a new evolution book

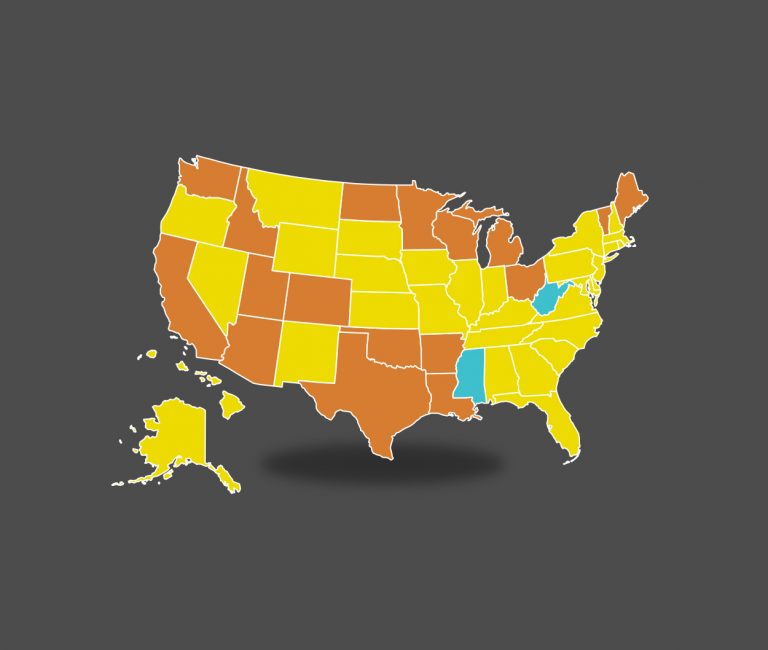
Graphs and diagrams for a investigative journalism article.

I presented about the features of good and bad graphs at the UW Showcase.
Part 2 of a vaccine infographic for a NOVA TV special.

Part 1 of a vaccine infographic for a NOVA TV special.

A seminar I am giving about good graphing techniques.